
Utility Bill Monitoring: Spotting Patterns That Signal Bigger Problems
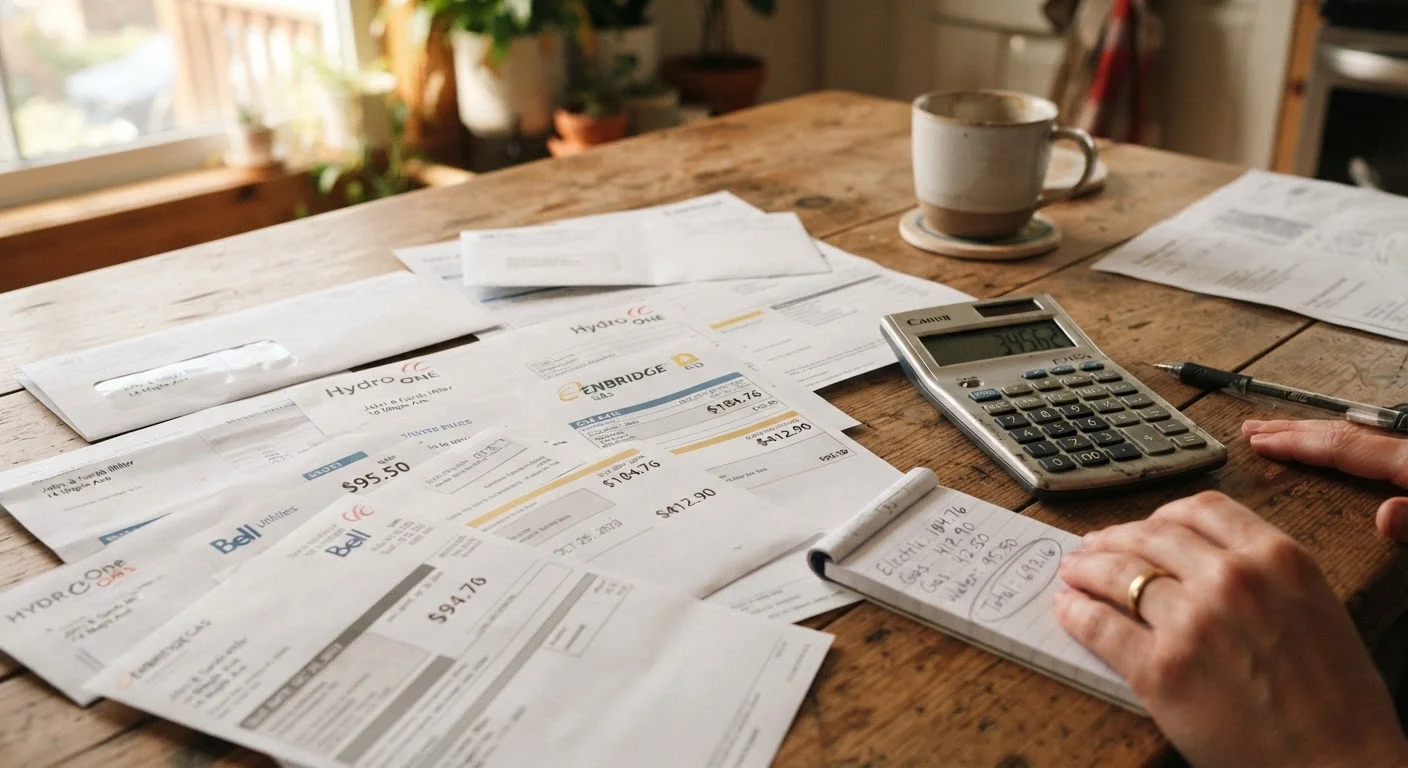
Photo credit: ArticlesHaven.net
In this article
Unusual spikes in water, gas, or electricity bills can be early signs of leaks or failing appliances. Here's how to read the signals.
Key Takeaways
- A sudden spike in your water, gas, or electricity bill is often the first detectable sign of a leak or failing appliance.
- Comparing bills month-over-month and year-over-year reveals meaningful patterns rather than seasonal noise.
- Most utilities provide online account portals with usage history that makes trend analysis straightforward.
- Small, consistent increases are as worth investigating as large single-month spikes.
- Catching problems early through bill monitoring can prevent expensive repairs down the line.
Why Utility Bills Are a Household Diagnostic Tool
Most households treat utility bills as a routine payment and nothing more. That's understandable - the numbers are easy to ignore when they don't seem dramatically out of range. But your water, gas, and electricity bills are among the few data points that reflect what's physically happening inside your home every single day. A slow leak, a failing appliance, a stuck HVAC system running at night - all of these show up as consumption anomalies before they cause visible damage.
The challenge is that month-to-month variation looks normal even when something is wrong. A warmer winter masks a furnace that's working twice as hard as it should. A busy summer obscures a dripping irrigation valve. That's why structured monitoring - not casual glancing at totals - is what actually catches problems early.
This kind of systematic review fits naturally into a broader habit of household financial awareness. If you're already doing a regular check on where money goes, a household savings audit is a useful framework that covers utility costs alongside other recurring expenses worth scrutinizing.
What you will need
Tools That Make Monitoring Easier
You don't need specialized software to monitor utility usage effectively - the tools most households already have are sufficient. That said, knowing what's available helps you work more efficiently.
Utility Online Account Portal
Provides historical usage data, billing history, and sometimes daily or hourly consumption graphs.
Spreadsheet Application
Used to log monthly usage figures and calculate percentage changes across billing periods.
Smart Meter or In-Home Energy Monitor
Displays real-time consumption data, making it easier to isolate which appliances or systems are drawing unusual amounts.
Water Meter
Reading your meter before and after a period of no use can confirm whether a silent water leak is present.
Utility portals have improved considerably and most now display usage graphs that make visual pattern-spotting fast. If your utility offers daily or hourly data (common with smart meters), you can often pinpoint not just that usage increased, but exactly when - which dramatically narrows the list of possible causes.
Reading Patterns: What Different Signals Mean
Use Year-Over-Year Comparisons
Comparing this January to last January is far more useful than comparing January to December. Seasonal factors like heating or irrigation can mask real changes when you only look at consecutive months. Most utility portals let you download 12-24 months of data at once.
Not all bill increases mean the same thing. Here's how to interpret common patterns:
- Gradual increase over 6-12 months: Often points to an aging appliance losing efficiency - a water heater, refrigerator, or HVAC system working harder to maintain the same output.
- Sudden single-month spike: More likely to indicate a discrete event - a leak starting, a thermostat failing, or a new device left running.
- Seasonal pattern that's shifted: If your summer electricity usage is noticeably higher than prior summers with similar weather, air conditioning efficiency or air sealing is worth checking.
- Consistent small overage every month: A leak that never stops - a running toilet, a dripping outdoor hose bib - shows up this way. Easy to overlook because no single bill looks alarming.
Don't Rely on Estimates Alone
Many utilities issue estimated bills when meters aren't read. A corrected actual reading the following month can look like a sudden spike when it's really just catching up. Always check whether a bill is marked 'estimated' or 'actual' before drawing conclusions.
Keeping tabs on utility patterns is also worth doing in the context of your broader recurring costs. Just as subscription services can quietly accumulate hidden costs, utility overcharges and inefficiencies compound over time without obvious single-point alerts.
Gas Bill Spikes Require Immediate Attention
An unexplained increase in your gas bill - especially one accompanied by a sulfur or rotten-egg smell - may indicate a gas leak, which is a safety emergency. Do not attempt to locate the leak yourself. Evacuate and contact your gas utility's emergency line or 911 immediately.
After the Fix: Verifying the Problem Is Resolved
One step many households skip is confirming that a repair actually solved the problem. After addressing an identified issue, track the next two full billing cycles to verify that usage has returned to your historical baseline. If it hasn't, either the repair was incomplete or there's a second contributing factor still active.
Document what you found and when in your utility log. Over years, this creates a repair and maintenance record that's useful when selling a home, filing an insurance claim, or evaluating whether an appliance is worth repairing again versus replacing. The same log that helps you catch problems also becomes evidence that your home has been responsibly maintained.
Gather at least 12 months of billing history
Log in to each utility's online account portal - electric, gas, and water - and download or screenshot your billing and usage history. Look for the actual consumption figure (kilowatt-hours for electricity, therms or CCF for gas, gallons or CCF for water), not just the dollar amount. Dollar totals fluctuate with rate changes, while usage figures reflect real behavior in your home.
Build a simple month-by-month usage log
Create a table with columns for month, usage amount, billing days in the cycle, and daily average usage. The daily average (total usage ÷ billing days) levels out short cycles and makes comparisons accurate. Do this separately for each utility. This is the foundation of all pattern spotting - without a consistent log, you're comparing apples to oranges.
Calculate year-over-year change for each month
Add a column showing the percentage change from the same month in the prior year. Formula: ((this year's usage − last year's usage) ÷ last year's usage) × 100. A 10-15% increase in a single month is worth noting; anything above 20% unexplained by obvious factors - a new appliance, extra occupants, an unusually hot summer - deserves active investigation.
Identify which utility is spiking and when
Isolate which utility shows the anomaly and the time of year it started. A water usage increase that began in spring and persists through summer could indicate an irrigation system leak or a running toilet. A gas spike in shoulder seasons - when heating demand is low - is more suspicious than one in January. The timing of the change narrows down the list of possible causes significantly.
Perform a physical check matched to the utility
For water: Turn off all taps and water-using appliances, then watch your water meter for 15-30 minutes. If the dial moves, you have a leak somewhere in the system. Check toilets (a slow leak can waste thousands of gallons monthly), faucets, and the main supply line.
For electricity: Unplug non-essential devices and appliances one circuit at a time while monitoring your smart meter or energy monitor for a drop. HVAC systems, water heaters, and older refrigerators are frequent culprits.
For gas: If you smell anything unusual, follow emergency procedures immediately (see the Important callout above). For non-emergency investigation, note which gas appliances - furnace, water heater, range - are running more frequently or longer than expected.
Decide whether to DIY or call a professional
Some causes - a worn toilet flapper, a dripping faucet, an aging refrigerator door seal - are straightforward DIY fixes. Others, including main water line leaks, furnace issues, or wiring problems, require a licensed plumber, HVAC technician, or electrician. When in doubt about the scope or safety of a repair, contact a qualified professional. The cost of a service call is almost always less than the cost of a worsening, unaddressed problem.
If the issue turns out to be appliance inefficiency rather than a fault, you may want to compare replacement options. For example, if your water heater is running harder than it should, comparing tankless versus traditional water heater options can help you weigh the trade-offs before committing to a replacement.
Set a recurring review cadence
Once your log is established, a monthly five-minute review is all it takes to stay current. Set a calendar reminder for the day each bill is typically available. Over time, your baseline becomes sharper and anomalies become easier to catch early - before a small drip turns into a water-damaged subfloor or a struggling furnace becomes a full replacement.

Author
Articles Haven Editorial Contributor
Articles Haven Editorial Team is the collective byline for our editorial team and contributor network. Articles published under this byline or an editorial pen name are researched, written, and reviewed according to our editorial standards for clarity, consistency, and independence before publication.
View all articles →